Data skills tips
for the field
Tips to collecting, managing and sharing data in humanitarian response
based on a work by Simon Johnson
adapted by Pierre Grandidier
Press right on your keyboard or swipe right to navigate
Click below to jump to a section
This guide is intended as a quick read for anyone who has or is going to be working with data collection and information management in a humanitarian emergency response context.
Many of the tips given will hopefully be obvious, but do address repeated mistakes encountered in this sector.

A temporary office after Typhoon Haiyan
Well managed and accurate data are key to making informed decision within the humanitarian sector. Information management can help to shed light on foreign or rapidly changing environments providing context to decision makers. Good and well managed information flows can make organisations more responsive and efficient leading to increased effectiveness.
This collection of tips is dedicated to emergency response delegates, staff and volunteers, and is a light version of the 50 humanitarian IM tips previously developed by Simon Johnson.
The tips here should not be considered hard and fast rules, but rather general guidance. The context of use can sometime require different and unique approaches.
Each page will provide a tip and a brief description. If you want to find out more about a particular tip then press down on your keyboard or swipe. Here you can find more information and links to resources providing further reading and learning materials.
Text here will indicate when you can press down
Pages when you slide down will contain extra information and learning materials about the tip.
The Basics
Use a spreadsheet for numerical data
There have been many examples in past humanitarian responses of numerical data being collected in a word processing document, or shared within a PDF document, when they would be more suited into a spreadsheet.
This means simple aggregation, sorting, operations and analysis cannot be completed without first importing into a spreadsheet.
MS Word and PDF tables may also be formatted in a way that does not copy well to spreadsheet meaning extra work and risk of additional human error before it can be used for analysis.
Press down for more
Microsoft Excel is the most commonly used, but there are free to use alternatives with slightly less functionality.
Google Spreadsheets: Webpage
Libre Office: Webpage
Connect with the Information Manager in your team, ask for support
In most cases during your deployment, there will be an information manager (IM) in your team. He will be a key contact for guidelines and a hub for sharing data and information.
If you are the IM, you can also ask for support within your roster, link to the regional IM, the SIMS remote support, and other organisations working on similar projects.
By sharing knowledge and collaborating on solving problems work can be completed quickly and efficiently.
SIMS stands for Surge Information Management System.
Learn more about SIMS: http://rcrcsims.org/
Save Often
This is a lesson quickly learnt by most through practical experience. Computers can be temperamental things and it can be soul destroying watching your computer crash and losing an hours worth of work. Save the anguish and save often!

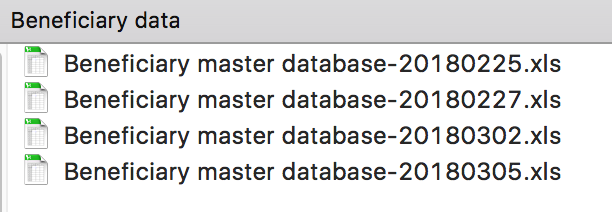
Use sensible file names
There are numerous attributes that you could include in a file name. The most important aspect is to make sure it is understandable to yourself, but also to others who might use your file without the full context. Some suggested components:
- Date - YYYYMMDD
- Description
- Your Initials
- Version Number
Save Multiple Versions
You might regret that big change you made to your work last week. It's best to save multiple versions as you progress so that you can easily revert any changes you have made.
Back up your data
Data although saved can sometimes be lost. This could be due to a virus, hard disk, user error or tens of other reasons.
With the prevalence of cloud services to save files to, work can be saved online for free.

Dropbox used in the IFRC Nepal 2015 earthquake response
Press down for more
There are a few cloud services providing free accounts for small amount of hosting. These can be used to sync a folder on your computer to be stored remotely. It can also be shared with other users.
Document your work
Starting from your first day, document your work as early and as much as possible. In a particularly dynamic context it will help you understand better the situation and will be an important source of information for the teams arriving after you and for the host national society you will handover to.
Collecting
Check whether data already exists and use secondary data reviews
It is worth reaching out to the information management community and the government in the area to check that the information has not already been collected by someone else. There is no need to duplicate work that has already been done.
The data you want may already exist only not in a clean single source. Consider whether it is possible to pull this data together through reviewing and collating other data sources.
Know how your data will answer your questions
There have been many assessments carried out where most of the data collected was never used. By deciding how you will use your data before you start, you can reduce the amount of redundant questions and make sure the right ones are asked.

Design your data template before you collect it
By designing your data template before collecting data it can give guidance to designing surveys and collecting data from multiple people.
If you want to know the damage in each area instead of asking each person an open ended question, providing a template ensures that the data will be collected consistently.

Use Mobile Data collection
Instead of doing paper based surveys data collection can be completed using mobile devices including phones and tablets. This allows for data validation on entry ensuring the data collected is consistent in nature.

Press down for more
There are a number of tools out there that can help with mobile data collection, some are free and some are paid for.
Open Data Kit - A free to use mobile data collection application
Kobotoolbox - A free to use mobile data collection application, based on ODK, without the need to install a server
MagPi - A commerical mobile data collection application
Consistent variable naming
If you are carrying out more than one round of surveys make sure that the variable names used in the data are clear and consistent with the previous surveys. Otherwise it can be very difficult for the person analysing the data to quickly match the questions together.
It is important to follow established variable naming conventions, so that it is easier for others to reuse your surveys and data.
Check meta data of data
If you are using or referring to other data make sure to check the meta data, or source of your data.
You must know how, when, where and by who the data was collected. This will give an indication as to how reliable the data is and in which ways the data can be used.

Understand the difference between quantitative data and qualitative data.
Qualitative data refers to stories which are intentionally gathered and systematically sampled, shared, debriefed, and analyzed. It will help you understand the context, produce insights and think about which decisions have to be made.
Quantitative data refers to information that can be measured and written down with numbers, standardised and normalised. It will enable you to use metrics to make sound decisions.
Spreadsheets
Only one piece of information per cell
Having more than one piece of data in a single spreadsheet cell prevents the ability to filter, sum or process a component of the list in any way. One way to resolve this is to duplicate the line for each component of the list.

Learn VLookups
Often you will need to look up other data based on a value in your data set. An example is you might have the names of the districts you are working in, but also want the official codes for these. A vlookup can pull through these official codes automatically.

Press down for more
Or learn index(match())
Using a combination of index function and the match function can create a more powerful look up.
Free learning material for learning vlookups
VLookup tutorial youtube video
Excel Easy tutorial
Free learning material for learning index(match)
Index(match) tutorial youtube video
Random Wok tutorial
Learn Pivot Tables
Pivot tables are a hugely powerful tool in spreadsheets. They are used for summarising, analysing and quickly manipulating data sets.

Press down for more
Free learning material for pivot tables
Record data at a granular level and use pivot tables to aggregate up and create reports
Many times people organise their data in the form it will be reported in.
However by aggregating up it restricts possible ways the data can be organised in the future if a new need appears.
It is always better to record data in the most basic possible format.
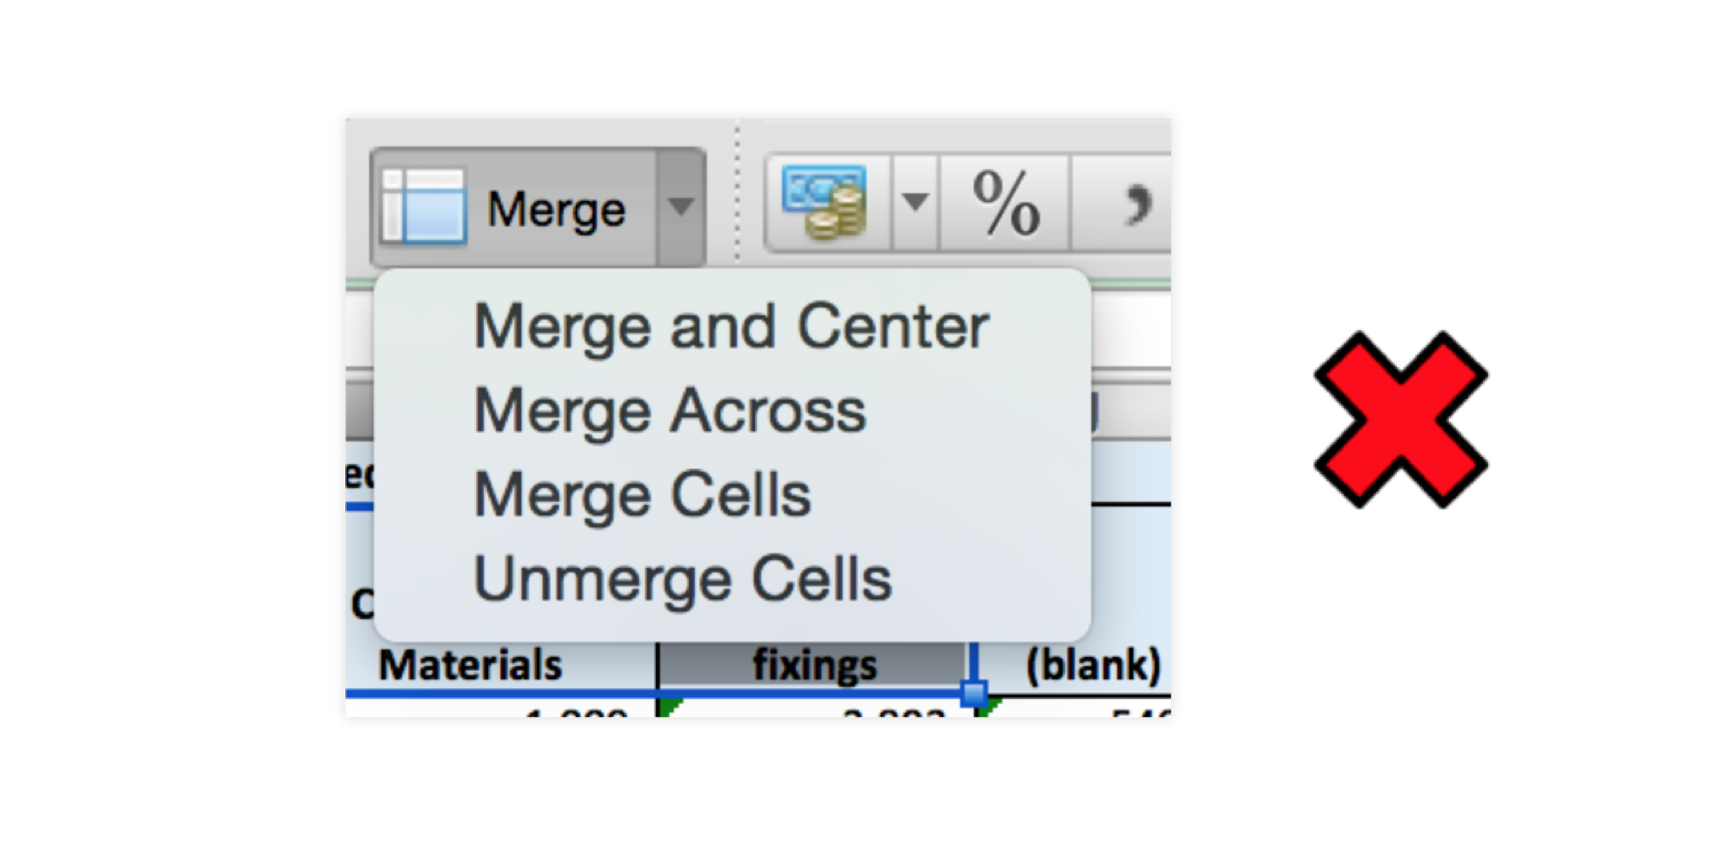
Do not merge cells in a spreadsheet
This can break some functionality in spreadsheets such as pivot tables and filters. An alternative method is to repeat the cell value or use colour to indicate the range.
Keep data types consistent in columns
Try to make sure that columns do not contain mixed data types such as numbers and words.
By making sure all the data types are the same it means that data operations (e.g. sum) can be carried out over the columns.

Keep all similar data in one sheet or data set
By placing data in separate sheets it hinders the process of aggregation.
Below is one spreadsheet with one tab for each district. It could have been put into one table with a column for district as in column A in the second image. If a report is needed for one district a pivot table can be used to generate this.

Do not use colour to represent data
When a machine reads the data or it is copied to another sheet there is a chance that the formating is lost along with the data it represents.
Create an extra column for the data attribute. Colour could still be used to highlight data.

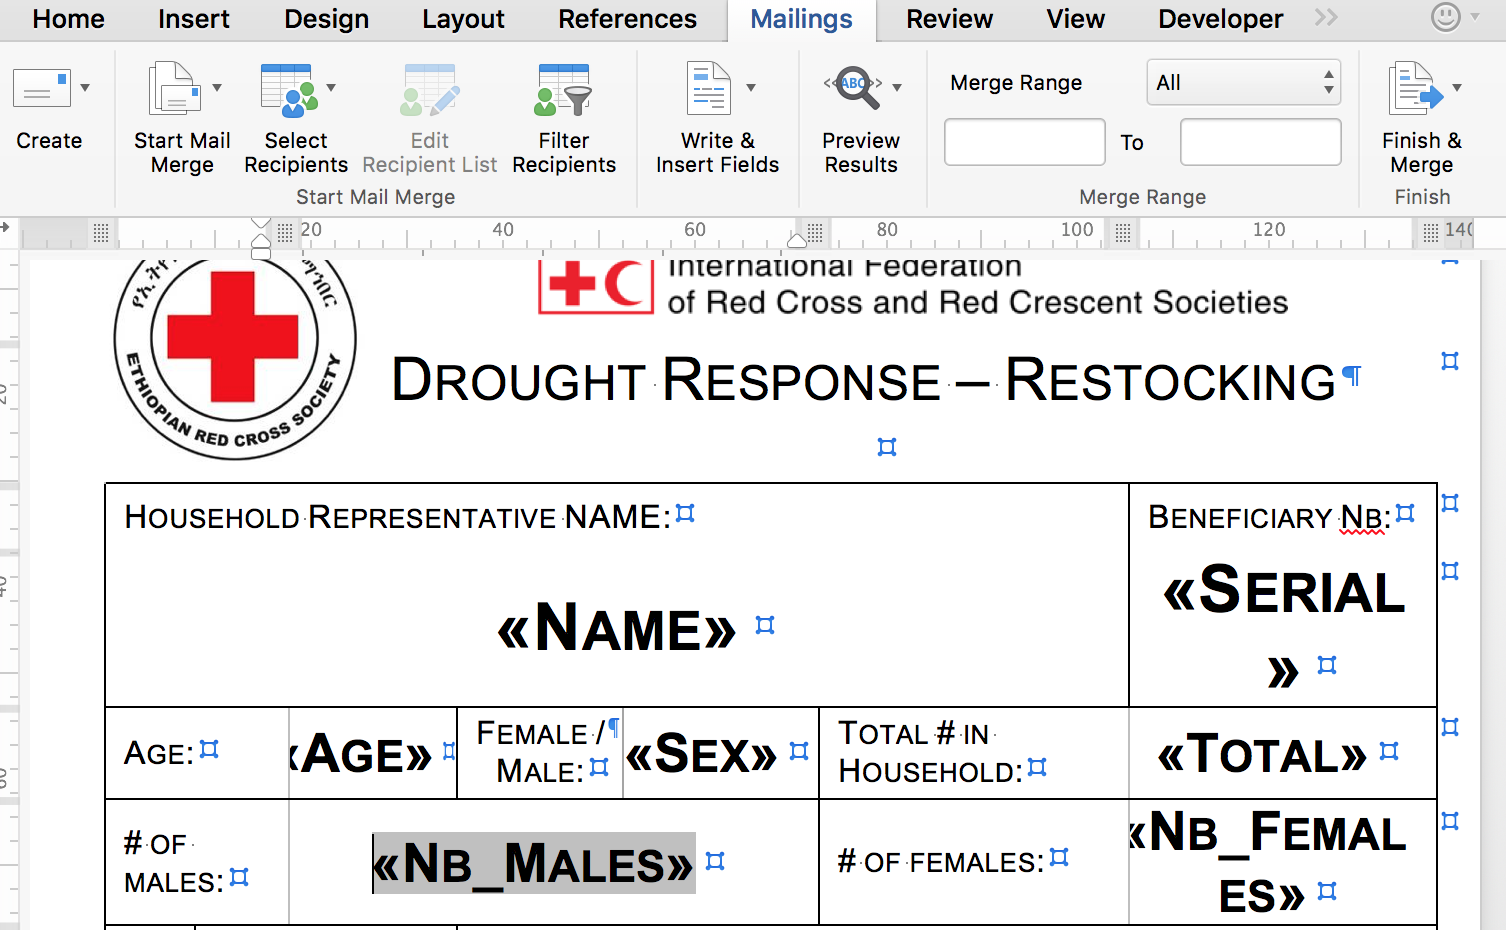
Learn mail merge
Once data has been collected, like beneficiary data, you will have to find a way to automise the creation of beneficiary cards. The mail merge functions between MS Word and MS Excel will enable linking Excel data with a Word template and process hundreds or thousands of cards in just a few minutes.
Press down for more
Free learning material for mail merge
Mail merge using an Excel spreadsheet
Red Cross Movement Cash Toolkit mail merge instructions to creating beneficiary cards
Remove Visual Noise
When building graphs, or for any other data visualisation, by removing unnecessary visual elements it allows for easier intepretation of the data.

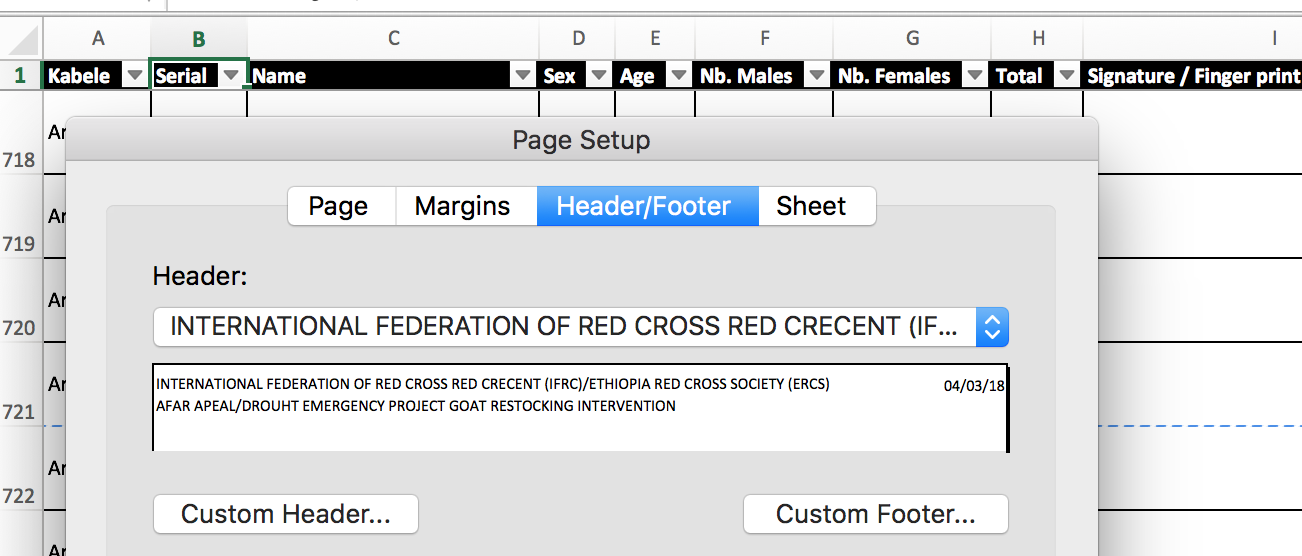
Prepare print-friendly tables
Creating print-friendly beneficiary lists is of major importance when preparing and accounting on beneficiary registration and beneficiary distribution. Although this is often thought as an obvious tasks, too many beneficiary list are still not printed and shared adequately. Some important aspects to take into account are the print area, informative header and footers with meta data, and intelligent page breaks.
Press down for more
Free learning material for print-friendly tables
Data Managing
Check your data
Sense check
Does your data make sense? If you have more people affected than the population of the area, something has probably gone wrong in the process.
Check maximums, minimums and sums
When reviewing your data always carry out checks on the extreme. If you have someone over 200 years old in your data you can probably safely assume that something needs correcting in the process.
Spot check your data
A spot check is a quick process where you pick 5 to 10 random lines of your data and check them thoroughly. It is especially important to do so with derived data.
It helps to check that your process is working consistently through the whole data set.

Check for duplicates
To quickly find and remove duplicates from your data make use of the sorting function on multiple columns. This will order duplicated rows next to each other.

Use official codes to represent regions and districts where possible
In many countries where humanitarians operations are being carried out there will be official codes from administration areas. As place names can be spelt in many ways especially where foreign characters are used it can be hard to compare and join datasets without these codes. Many hours of time can be saved by using them.

Get coordinates for point data
If you have data that represents a point such as a hospital or a household instead of just naming it or giving its address you could also collect coordinates for it. There are many possible ways of doing this.

Press down for more
A GPS device can be used to get coordinate points. Most smartphones now contain the technology to do this. Mobile data collection applications can also help with the process.

Addresses can be geocoded to get coordinates. However in many developing countries the addresses are not well documented or are non-existent. It's better to record the coordinate data at the same time as data collection.
Soft skills
Verbal Communication
While information management products can communicate the data and a message, emergency response delegates will often find themselves in meetings and presentations.
Being able to work in teams, verbally communicate the data and simplify complex ideas is key for the progress of an emergency response.
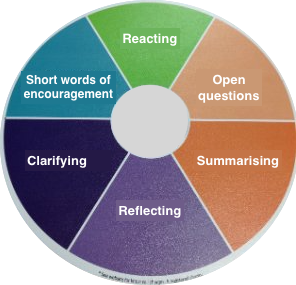
Listen
Listen and be patient while understanding the needs and ideas of others. Find out their contraints and resources. Summarise what you think they want and get them to agree. Don't build what you think they need, make what they actually need. Follow the steps on the listening wheel below to help.
Distill the questions
The question the user may originally pose or product that the user may ask for might not always be what they actually want. Sometimes people make their own intepretation of solving a problem.
By discussing the problem and ideas with them better solutions may be found.
Don't make assumptions about the user
When talking to users or producing products for them, make no assumptions about what they already know.
Listen to their constraints and knowledge.
Take breaks and get good sleep
Humanitarian Response can be stressful and exhausting work.
Give yourself regular breaks and make sure you get enough sleep!
Get Involved
Get Involved
This is an open source project so anybody can add tips and resources to make it more comprehensive.
Contact Simon Johnson or Pierre Grandidier for more details.
This project is hosted on Github.
Thanks To...
Simon Johnson
Andrew Braye
Heidi El Hosaini
Robert Banick
Jean Mège
Jagoda Pietrzak
Shruti Grover